Reading the Business Behind a Kenyan Share Price
Part 2 of 4: Financial statements, sector economics, and valuation
A company becomes easier to analyse when the investor can describe how it earns a shilling and what happens before that shilling reaches shareholders. A brewer buys inputs, produces stock, sells through a distribution network, collects payment, and funds the next production cycle. A bank gathers funding, allocates credit, earns interest and fees, absorbs losses, and maintains capital. An insurer accepts uncertain future obligations in exchange for premiums and invests funds while claims develop. These operating differences shape the financial statements and the valuation method. This article follows them through a practical research process. The accompanying workbook provides connected calculations, while the appendix explains the technical formulas and their assumptions. The objective is a valuation range whose business logic you can understand, question, and update when new evidence arrives.
Begin with a short business description before opening the ratio table. Identify the main products, customers, regions, revenue drivers, and recurring obligations. Then ask what allows the company to earn attractive returns: price, volume, distribution, scale, convenience, specialised assets, or a combination. A useful answer links the competitive advantage to an observable measure. Pricing power may appear in margins and customer retention. Efficient distribution may appear in turnover and working capital. A strong funding franchise may appear in deposit stability and funding costs. This gives the investor a way to test the business story against the statements. It also helps select comparable companies because businesses with similar labels can have very different revenue sources, capital needs, geographical exposures, and sensitivity to changes in demand or financing conditions.
The annual report can then be read as a connected account of operations and ownership. The income statement explains earnings over a period, the balance sheet records resources and obligations at a date, and the cash-flow statement follows movements in cash. Changes in equity connect profits, distributions, new capital, and other adjustments to the shareholders' position. The SEC's introductory guide offers a useful explanation of these relationships [1]. For Kenyan issuers, the investor then works with the accounting framework and policies used in the actual report. Read the auditor's opinion, key audit matters, accounting policies, and supporting notes alongside the primary statements. These sections identify where estimates, classifications, or uncertainty are important enough to affect the interpretation of an apparently simple growth rate or valuation multiple.
Build a comparable financial record
Five years of comparable information usually reveal more than a single result. Create a record of revenue, margins, profit attributable to ordinary shareholders, operating cash flow, capital expenditure, debt, equity, and shares. Preserve fiscal-year dates and distinguish consolidated group figures from the parent company's figures. Where comparatives have been restated, use a consistent series and record the reason. Acquisitions and disposals also deserve a bridge because they can change the size of the reported business without changing the performance of the original operations. The workbook includes places to record these distinctions rather than blending them into a single growth number. Once the record is consistent, the investor can ask whether improvement comes from stronger operations, a larger reporting perimeter, financing effects, tax changes, or an unusual gain.
Revenue analysis begins by separating price from volume where the company supplies enough information. Higher selling prices can support revenue while customers buy fewer units. Expansion into a new region can create growth alongside substantial initial costs. Currency translation can change reported shillings even when local activity moves differently. A useful research note identifies the drivers that explain most of the change and tests whether they can continue. For a manufacturer, that may involve input costs, product mix, production utilisation, and distribution. For a telecommunications business, it may involve active customers, usage, service pricing, and the cost of extending the network. The modelling choice follows the evidence: use the most specific reliable drivers available, and use aggregate assumptions where a more detailed breakdown would require information that the company has not supplied.
Margins translate those revenue drivers into operating performance. Gross margin helps explain the relationship between sales and direct costs, while operating margin incorporates the broader cost of running the business. Changes in margins deserve a practical explanation. A company may improve profitability through pricing, procurement, automation, lower distribution costs, or a shift towards more profitable products. It may also benefit temporarily from lower input prices or deferred expenditure. The investor can compare management's explanation with segment disclosures and several years of results. This creates a more useful forecast than extending the latest percentage indefinitely. In the workbook, revenue growth and operating margin are independently editable by year, allowing the investor to test combinations such as slower sales with stable efficiency or stronger sales with investment-related pressure on margins.
Normalising earnings means identifying the level of profit that best represents the business being valued. Asset-disposal gains, unusual impairments, litigation, restructuring, and currency effects may deserve separate treatment, depending on their recurrence and economic significance. The adjustment should show both the reported figure and the reason for the alternative estimate. Some costs described as exceptional recur often enough to be part of the operating pattern. Some gains represent a real release of value but contribute little to next year's trading profit. Keeping these distinctions visible allows the investor to evaluate both the current result and the forward earnings base. It also makes the valuation easier to challenge: another reader can accept the reported accounts while choosing a different normalisation assumption and observing the effect on the estimated value.
Per-share analysis keeps the focus on the investor's ownership claim. Total profit can rise while earnings per share grow slowly if additional shares have been issued. A buyback can have the opposite effect, although its value depends on the purchase price and the use of cash. Dividends, earnings, book value, and valuation should therefore use consistent share definitions and periods. Basic and diluted earnings may differ where potential shares exist, and a closing share count can differ from the weighted average used for reported earnings. The workbook records units explicitly so millions of shillings and millions of shares produce shillings per share. This is a small technical detail with a large practical effect: an incorrect share denominator can make an otherwise thoughtful valuation appear dramatically cheaper or more expensive than it really is.
Follow profit into cash and capital
Operating cash flow explains how the accounting result connects to cash generated by activity. IAS 7 classifies cash flows into operating, investing, and financing categories, with the relevant accounting policies affecting the presentation [2]. For a nonfinancial company, changes in receivables, inventory, and payables are often central to the bridge. A profitable expansion may initially consume cash as stock and customer credit grow. A decline in activity may temporarily release cash by reducing those balances. The investor can therefore compare cash conversion across several years and examine the underlying operating movements. This turns a cash-flow ratio into a business explanation. It also provides useful forecast drivers because future growth will often require additional working capital before the new sales have been fully collected.
Equation (2.1), operating working capital = trade receivables plus inventory minus trade payables, creates a manageable starting point for a manufacturer. The next step is to connect each balance to activity. Receivable days estimate how long sales remain unpaid, inventory days estimate how long stock is held, and payable days estimate how long suppliers finance purchases. When purchases are unavailable, cost of sales can serve as an explicitly labelled proxy for payable days. Average balances improve the comparison where opening and closing values are available. Seasonal businesses may require more frequent observations because a year-end balance can be unrepresentative. The appendix explains the exact formulas and manual calculations. In the body of the analysis, the useful question is how much additional cash the company needs when sales or payment behaviour change.
A negative cash-conversion cycle can be commercially attractive because customers pay before the company settles the associated supplier obligations. Understanding its cause is essential to assessing durability. Prepaid sales and reliable supplier terms can support a stable pattern, while overdue payments or temporary inventory reductions can produce a similar numerical result through a different process. Supplier-finance arrangements also deserve separate attention because they can change the interpretation of payables and cash flows. The sector-screen sheet lets you compare an efficient cycle, slower collections, and longer supplier credit using the same formulas. You can then ask which changes reflect a repeatable operating advantage and which represent financing pressure. The conclusion feeds directly into the cash forecast, dividend capacity, and the amount of financial flexibility available during a difficult trading period.
Capital expenditure links today's cash to tomorrow's productive capacity. Maintenance spending preserves existing operations, while expansion spending aims to create additional earnings. Companies may provide useful information about projects, capacity, network investment, or replacement programmes, although the split between maintenance and growth is often an analytical estimate. Record that estimate and test alternatives. Depreciation offers context about past capital consumption, but future replacement costs and technology can change the cash required. Equation (2.2), cash after capital expenditure = operating cash flow minus capital expenditure, provides a simple cash measure for the initial review. The valuation model then develops an unlevered cash-flow measure with consistent tax and financing treatment. The distinction helps the investor avoid mixing cash available after interest with a discount rate designed for cash available to all capital providers.
Debt analysis turns the balance-sheet total into a schedule of obligations. Record the currency, interest structure, maturity, security, covenants, and access to refinancing for material facilities. A company with moderate debt and a concentrated near-term maturity can face a different problem from one with higher debt spread across several years. Foreign-currency borrowing adds another sensitivity when operating cash is mainly in shillings. Cash balances also need classification because some may be restricted or held in subsidiaries with distribution constraints. The integrated teaching model uses a simple debt schedule with interest on opening debt and explicit principal repayments. This keeps the cash consequences visible. A company-specific version can extend that schedule to multiple facilities, changing rates, and refinancing assumptions as the relevant disclosures become available and material to the valuation.
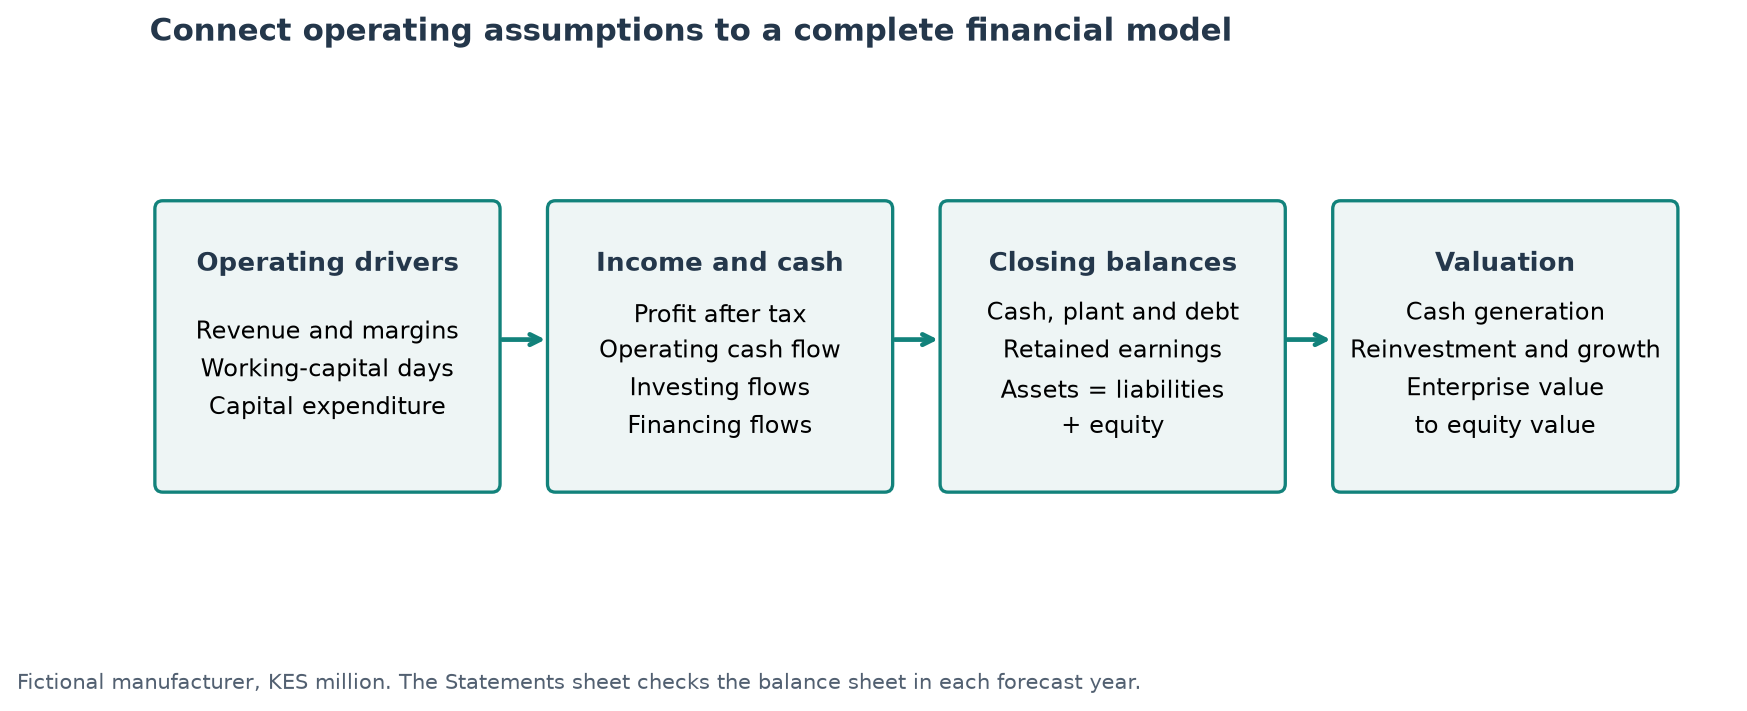
The balance sheet provides the reconciliation that ties these decisions together. In the teaching model, plant rolls forward through capital expenditure and depreciation, debt rolls through repayments, equity rolls through profit and dividends, and cash rolls through operating, investing, and financing flows. The resulting assets equal liabilities plus equity in every forecast year. Cash emerges from the operating and financing assumptions rather than being inserted to force that equality. This is useful because an ambitious dividend or investment plan can now reveal a funding shortfall. The investor can respond by changing the planned distribution, financing, growth, or spending assumptions and examining the consequences. A connected model turns an appealing business story into a set of commitments that must work together over time, making the valuation more informative and easier to audit.
Analyse banks through losses, funding, and capital
For a bank, asset quality is a central link between current earnings and future distributions. Read the gross loan book, nonperforming loans, impairment allowances, write-offs, recoveries, and movement between credit-quality categories. IFRS 9 provides the expected-credit-loss framework used in the accounting analysis [3]. The practical question is how changes in borrower performance and economic expectations affect the profit available to shareholders. A falling nonperforming-loan ratio can reflect collections, write-offs, loan growth, or changes in classification. Each route has different implications. The workbook's banking analysis therefore uses several measures together and records their definitions. This helps the investor connect the stock of troubled assets with the current impairment charge and the remaining exposure, producing a clearer view of the bank's capacity to absorb further deterioration while supporting its business.
Coverage ratios are most useful when the numerator and denominator are precisely matched. An investor might compare impairment allowances with nonperforming loans, but published definitions can include or exclude collateral, interest in suspense, regulatory reserves, and different categories of exposure. Record the chosen basis and use it consistently across periods and peers. The current credit-loss charge is a flow, while the allowance is a balance-sheet stock, so the two answer related but separate questions. A practical review follows the allowance from opening balance through new charges, recoveries, write-offs, currency effects, and closing balance where disclosed. This can reveal why a lower charge coexists with a significant remaining problem book. It also makes stress testing more useful because an additional loss assumption can be connected to earnings and capital rather than applied as an isolated percentage.
Funding and efficiency determine how much income is available before credit losses. Net interest income reflects asset yields, funding costs, and the balance-sheet mix. Fee income can diversify revenue but may have its own volume and regulatory sensitivities. The cost-to-income ratio then shows how operating expenses relate to the selected income measure. A useful bank forecast separates revenue growth, operating costs, and impairment rather than collapsing them into one profit-growth assumption. It can test lower lending yields alongside sticky deposit costs, slower fees, or a rise in collection expenditure. The investor should also examine deposit concentration and maturity information because funding stability affects the bank's room to respond. These operating relationships explain how a bank can remain profitable while its distributable capacity changes materially between otherwise similar reporting periods.
Capital connects the bank's balance sheet with its ability to grow and distribute. The relevant ratio compares eligible regulatory capital with risk-weighted assets, using the rules applicable to the regulated entity. CBK's supervision reports provide regulatory context, while the issuer's disclosures establish the actual entity-level position [4]. A regional group may have subsidiaries governed by different requirements, so group equity and a single headline ratio need an appropriate bridge. The teaching model makes its simplifying assumption explicit: opening equity is used as a proxy for eligible capital. It then calculates the retention needed to support assumed growth in risk-weighted assets. The result helps explain why a strong accounting profit can be divided differently between dividends and retained capital as lending opportunities, loss expectations, and required buffers change.
Read insurers and asset-heavy businesses on their own terms
Insurance combines underwriting obligations with investment activity, and the two need a clear bridge to shareholder profit. For a short-tail non-life illustration, the loss ratio and expense ratio can be added when both use the same earned-premium denominator. The resulting combined ratio explains the underwriting result before investment and other items. Published IFRS 17 reporting requires attention to insurance revenue, service expenses, reinsurance, and the issuer's own performance definitions [5]. Life insurance introduces further features, including the release of profit as services are provided. The workbook therefore presents its earned-premium example as a defined teaching model and provides a review field for mapping a real issuer's disclosures. This allows the investor to use the arithmetic confidently while preserving the accounting and business distinctions that determine what a published ratio actually measures.
Equation (2.3), shareholder profit = underwriting result plus investment and other results minus financing costs and tax, organises the simplified insurance bridge. Return on equity then compares attributable profit with average equity over the period. A strong investment year can support profit even when underwriting is weak, while market losses can reduce returns during an otherwise sound underwriting period. Net asset value requires its own examination of investment valuations, liabilities, minority interests, and the ownership structure. Jubilee's annual report provides separate group and company information and notes explaining earnings per share and dividends [6]. The practical research task is to identify which earnings and assets belong to the listed shareholders and how cash can move to them. That ownership perspective makes a price-to-book comparison more informative than treating every shilling of consolidated assets as equally distributable.
Agriculture, energy, and investment holding companies extend the same principle of matching the method to the business. Agricultural analysis follows crop volumes, realised prices, weather, seasonal working capital, and the distinction between cash earnings and biological-asset valuation movements. Energy analysis follows capacity, output, tariffs, offtaker payments, maintenance, project commitments, and financing currency. Holding-company analysis looks through to the underlying assets, then subtracts central debt, costs, taxes, and other leakage where relevant. These subjects belong in the research log even when the initial portfolio contains only a small allocation to the sector. They identify the assumptions most likely to change value. The investor can then build a focused model around those drivers instead of applying a bank or manufacturer template mechanically to a business with a different operating and ownership structure.
Test value traps before relying on a low multiple
A low price-to-earnings or price-to-book multiple is a research invitation, not proof of value. In a frontier-market setting, the investor should test whether the apparent discount reflects a temporary concern, a structural reduction in earning power, a weak ownership claim, or a trading constraint that makes the market price difficult to realise. This is where a valuation model and an issuer review meet.
| Value question | Evidence to inspect | Why it can change the conclusion |
|---|---|---|
| Is the business understandable? | Revenue drivers, customer economics, operating risks and disclosures the investor can explain. | A forecast is less reliable when it depends on a business mechanism the investor cannot test. |
| Is there an economic advantage? | Distribution, brand, switching costs, funding franchise, operating scale, specialised assets or a durable regional position. | A historical margin or return on equity may decline if its source is not durable. |
| Does management allocate capital well? | Capital expenditure outcomes, acquisitions, debt policy, share issuance, dividends, related-party disclosures and board oversight. | Reported earnings do not automatically become value for listed shareholders. |
| Can the investor own and exit the position? | Free float, turnover, bid-ask spread, dealing history, position size and the time needed to sell in a stressed market. | A quoted price may overstate the amount that can be invested or realised at that price. |
| Does the valuation survive a weaker case? | Lower volume, weaker margin, slower collection, credit losses, currency pressure, higher funding costs or delayed investment returns. | A small base-case discount may disappear when ordinary business risks are modelled. |
The appropriate response is not a universal liquidity haircut or a fixed ratio threshold. Record the evidence, build a case range, and limit the position to an amount that remains workable under the observed trading conditions. This keeps the margin of safety connected to the business, ownership rights and implementability instead of treating it as a number produced by a screen.
Match the valuation method to the distributable claim
A discounted cash-flow model is normally useful for a nonfinancial company when operating cash generation, reinvestment and financing can be distinguished with reasonable evidence. Banks, insurers and mature distribution businesses can require an equity-focused method because regulatory capital, policyholder obligations or necessary investment affect the cash that may safely be distributed. The method should follow the economics of the issuer, not a rule based only on its sector label.
For a mature business whose dividends are supported by sustainable earnings and capital capacity, a dividend-discount cross-check can make the assumptions visible:
Here, \(D_1\) is the next-period dividend consistent with the forecast, \(k_e\) is the shareholder's required return, and \(g\) is a long-run growth rate. The relationship becomes unreliable if \(g\) approaches or exceeds \(k_e\), if dividends do not reflect sustainable distributable capacity, or if the issuer must retain material capital to fund growth or absorb losses. For a bank, the separate capital-capacity analysis remains essential. For a telecommunications or industrial business, the DDM should be reconciled with the reinvestment and free-cash-flow story rather than used as an alternative to understanding it.
Required returns should be calibrated from a dated local-currency opportunity cost, business risk, leverage, currency mismatch and the liquidity actually available to the holder. When the investor's future spending is in a different currency, include that exposure in the scenario analysis instead of quietly lowering the shilling discount rate or the required return. This approach avoids importing a foreign-market hurdle rate or treating a single government-security yield as a complete cost of equity.
Estimate value from cash generation and required returns
Valuation begins by asking what the investor expects to receive and what return compensates for committing money to that opportunity. BAT Kenya supplies a dated nonfinancial case rather than a fictional manufacturer. Its FY2025 annual report recorded revenue of KES 23,191.945 million, EBIT of KES 7,474.835 million, operating cash flow of KES 6,633.154 million, capital expenditure of KES 301.833 million and earnings per share of KES 52.46 [10]. The NSE daily price list recorded a KES 560 volume-weighted average price on 11 September 2026 [11]. These reported values establish the operating scale and the price observation. They do not establish a target price.
| BAT Kenya FY2025 evidence | Reported value | Use in the case |
|---|---|---|
| Revenue | KES 23,191.945 million | Starting scale for the explicit operating scenario |
| EBIT | KES 7,474.835 million | Margin and after-tax operating-profit bridge |
| Operating cash flow | KES 6,633.154 million | Cash-conversion cross-check |
| Capital expenditure | KES 301.833 million | Reinvestment starting point |
| Fiscal dividend per share | KES 70.00 | Distribution-quality and payout discussion |
| Earnings per share | KES 52.46 | Payout and ownership-claim cross-check |
| NSE VWAP, 11 September 2026 | KES 560.00 | Dated price observation, not a guaranteed execution price |
The workbook forecasts operating cash available to all capital providers after tax and reinvestment, then discounts those cash flows at a matching required return. Its five forward years use stated assumptions for revenue growth, EBIT margin, working-capital days, capital expenditure, tax, required return and terminal return on invested capital. They are teaching scenarios calibrated from the FY2025 evidence, not BAT guidance, forecasts, or a recommendation. A terminal calculation represents the business beyond the explicit forecast. Cash and nonoperating assets are added where appropriate, debt and other claims are deducted, and the result is divided by shares. The appendix contains the detailed discounted-cash-flow formulas and every step of the worked case. The practical focus is the set of business assumptions behind them: sales, margins, tax, working capital, productive investment, financing, and the returns the company can earn as it moves towards a more mature operating pattern.
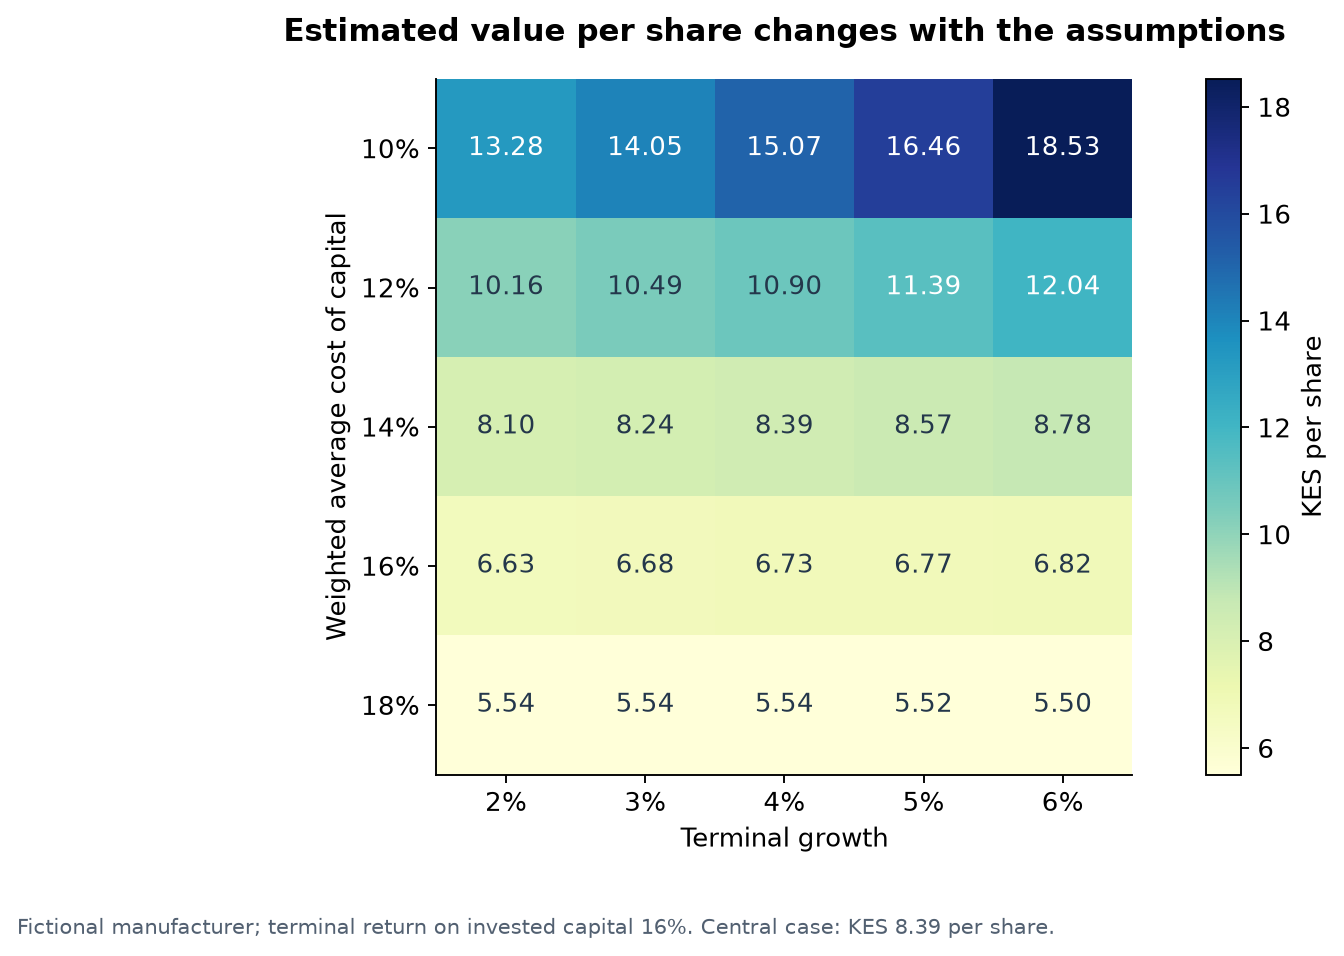
The terminal period deserves particular care because growth requires resources. Damodaran's valuation material connects stable growth to the reinvestment needed at the assumed return on capital [7]. In the BAT Kenya case workbook, the base scenario uses a 3% perpetual growth assumption and an 18% return on new capital, implying that approximately 16.67% of after-tax operating profit is retained for reinvestment in the terminal period. The remaining portion supports the terminal cash-flow calculation. Raising growth therefore changes both the future profit level and the resources required to sustain it. This is economically more informative than increasing growth while leaving investment unchanged. The sensitivity grid recalculates the full relationship across required returns and growth rates. It gives the investor a range to interpret and makes the assumptions behind a high terminal value visible, including how much of the total valuation depends on events beyond the explicit forecast.
Banks and insurers often benefit from valuation methods centred on equity, distributions, and returns on equity, as developed in Damodaran's treatment of financial-service firms [8]. The workbook includes a steady-state price-to-book model that connects sustainable return on equity, growth, and the shareholder's required return. It also includes a separate near-term capital-capacity calculation. Together, these provide two useful views: what a mature stream of equity earnings might be worth and how much current profit can be distributed while supporting the assumed capital requirement. A price below book value can be attractive when future returns justify more than the market price. It can also reflect low earning power or risks within the assets. The investor's task is to explain which interpretation fits the evidence and how sensitive the value is to a different outcome.
Market multiples offer a useful cross-check when their inputs and peer groups are consistent. Price-to-earnings compares the equity price with earnings available to that ownership claim. Enterprise-value multiples compare operating value with operating measures before financing. Price-to-book is often relevant where assets and capital play a central role in generating earnings. Each multiple carries assumptions about growth, profitability, reinvestment, risk, and accounting quality. The investor can compare a company with peers and its own history, then explain the reason for any premium or discount. This keeps the multiple connected to the business. A low multiple becomes a research question about the durability of earnings and the required return, while a high multiple becomes a question about the growth and quality already embedded in the purchase price.
Equation (2.4), margin of safety = one minus purchase price divided by estimated value, expresses the difference between price and a selected valuation estimate. The estimate should come from a range of coherent cases. A base case might assume steady demand and normal collections, while a weaker case combines slower sales, narrower margins, and delayed customer payments. A stronger case should also fund the investment needed to support its growth. The investor can compare the proposed entry price across all three cases and decide how much uncertainty the position size can accommodate. This turns a margin-of-safety percentage into a practical judgement about resilience. The accompanying sensitivity tables then identify which inputs deserve the most research attention because small changes in them produce large differences in estimated value.
Financial scoring can help organise that attention. Piotroski's peer-reviewed research examined how historical statement signals helped distinguish outcomes within a high book-to-market investment setting [9]. Its broader lesson for this exercise is the usefulness of combining several aspects of financial change rather than relying on one attractive ratio. The workbook's review process therefore looks at profitability, cash conversion, financing, efficiency, and ownership together, with sector-specific interpretation. A score can summarise the observations, but the supporting evidence remains valuable when a company is unusual or undergoing change. The investor can document why a weaker recent metric might improve, what would confirm that improvement, and how much capital to commit before it becomes visible. This creates a disciplined research process that remains open to business developments instead of treating the screen as the final judgement.
The final company note should connect the research to a decision. Describe how the business earns money, the financial evidence supporting that view, the valuation range, and the assumptions that would materially change it. Add the expected source of shareholder return, the major risks, and the conditions that would lead to further buying, a smaller position, or an exit. The workbook provides the calculations, while the note preserves the reasoning that makes those calculations useful. You now have more than a dividend candidate: you have an ownership case with a price range and a clear account of uncertainty. The next article combines several such cases into portfolios, where the interaction between holdings, household needs, and market liquidity becomes as important as the attractiveness of each company considered separately.
Technical appendix and formula dictionary.
References
[1] U.S. Securities and Exchange Commission, “Beginners' Guide to Financial Statements”. [Online]. Available: Source. Accessed: Sep. 7, 2026.
[2] IFRS Foundation, “IAS 7 Statement of Cash Flows”. [Online]. Available: Source. Accessed: Sep. 7, 2026.
[3] IFRS Foundation, “IFRS 9 Financial Instruments”. [Online]. Available: Source. Accessed: Sep. 7, 2026.
[4] Central Bank of Kenya, “Bank Supervision Annual Report 2024”. [Online]. Available: Source. Accessed: Sep. 7, 2026.
[5] IFRS Foundation, “IFRS 17 Insurance Contracts”. [Online]. Available: Source. Accessed: Sep. 7, 2026.
[6] Jubilee Holdings, “2025 Annual Integrated Report”. [Online]. Available: Source. Accessed: Sep. 7, 2026.
[7] A. Damodaran, “Excess Returns and Terminal Value”. [Online]. Available: Source. Accessed: Sep. 7, 2026.
[8] A. Damodaran, “Valuing Financial Service Firms”. [Online]. Available: Source. Accessed: Sep. 7, 2026.
[9] J. D. Piotroski, “Value Investing: The Use of Historical Financial Statement Information to Separate Winners from Losers”, Journal of Accounting Research, vol. 38, suppl., pp. 1–41, 2000. [Online]. Available: Source. Accessed: Sep. 7, 2026. [10] BAT Kenya PLC, “Combined Annual and Sustainability Report 2025”, 2026. [Online]. Available: https://www.batkenya.com/content/dam/endmarkets/ke/en/download/investors-and-reporting/annual-reports/BATK_Combined_Annual_and_Sustainability_Report_2025.pdf. Accessed: Sep. 12, 2026.
[11] Nairobi Securities Exchange, “Daily Price List, 11 September 2026”. [Online]. Available: https://www.nse.co.ke/wp-content/uploads/11-SEP-26.pdf. Accessed: Sep. 12, 2026.
No public comments yet. The first thoughtful question can start the discussion.