What a Kenyan Share Can Pay You;and What It Costs to Own
Part 1 of 4: Dividends, Treasury bills, and a useful screening process
An investor with one million shillings can begin with a surprisingly practical question: what should this money accomplish over the next twelve months, and what should remain possible ten years from now? Perhaps some income will pay school fees, some will be reinvested, and some must stay available while a business opportunity develops. Those purposes lead to different combinations of shares, Treasury bills, and cash. This series follows that decision from the first company screen through financial statements, valuation, portfolio construction, and ongoing management. The portfolios are educational examples that you can inspect and adapt. Their usefulness comes from showing the decisions inside the numbers: what is reported, what is assumed, how an assumption changes the result, and which information would make the next decision better.
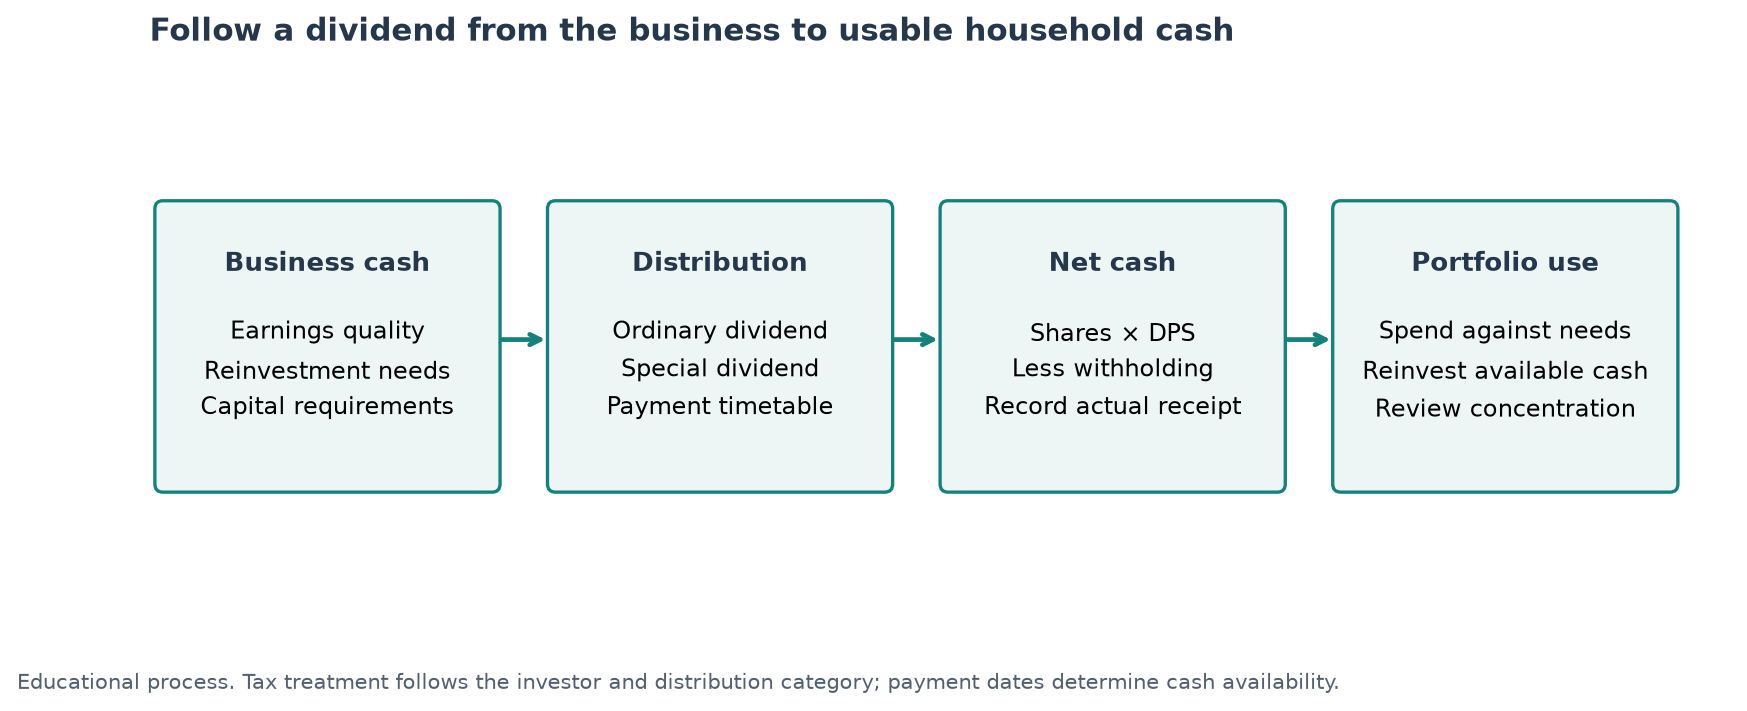
A dividend is an accessible starting point because it turns ownership into an observable cash receipt. Yet the receipt belongs to a larger economic process. Customers pay a company, the company meets operating obligations, management decides how much to reinvest, and the board proposes or declares a distribution under the applicable process. The investor then receives cash after any withholding. Following this chain helps explain why two shares with similar displayed yields can offer very different experiences. One business may distribute steadily while expanding its earnings base. Another may release accumulated reserves after a disposal. A third may retain most earnings to fund attractive growth. The research task is to understand the source and likely durability of the payment, then compare its value with the price of acquiring the shares.
The accompanying screening workbook starts with the NSE issuer directory and separates that directory from the investable research list [1]. A directory is useful for identifying issuers, sectors, and instruments. Current trading status, the available share class, corporate actions, and liquidity are additional fields to establish before constructing orders. This matters especially when a directory includes legacy entries, recently admitted securities, investment trusts, or funds alongside operating companies. The workbook keeps these distinctions visible and provides a place to record the evidence. A company can remain an interesting research case while a suspension, thin order book, or unresolved corporate action makes it unsuitable for a particular implementation schedule. That separation lets the investor learn broadly and deploy money selectively, with a clear record of the reason for each choice.
Start with the payment, period, and purchase price
Dividend yield connects an annual payment per share with an entry price. KCB's FY2025 ordinary distribution was KES 4 per share and the NSE daily price list recorded a KES 94 volume-weighted average price on 11 September 2026 [2], [3]. Equation (1.1), gross dividend yield equals annual dividend per share divided by share price, gives approximately 4.26% for the ordinary distribution. The fiscal-year amount including the KES 3 special distribution gives approximately 7.45%. The payment amount and price observation are now both dated. That makes the price timestamp an essential part of a dividend comparison. It also encourages a useful question whenever a yield rises sharply: has the company increased its distribution, has the share price fallen, or have both moved? Each explanation opens a different line of business research and a different set of valuation assumptions.
The period attached to the dividend deserves equal attention. A fiscal-year total may include an interim payment and a final payment, while a trailing twelve-month cash total follows actual payment dates. These measures can differ around reporting dates, delayed payments, or changes in the distribution schedule. A forward dividend estimate adds another layer because it depends on future board decisions and business results. The workbook therefore stores the fiscal period and source beside the dividend rather than presenting a percentage alone. When updating it, record whether the number is paid, declared, proposed, or assumed for the next period. This small habit makes comparisons far more useful: you can tell whether an apparent income improvement reflects stronger recurring earnings, a calendar effect, or a payment that remains subject to approval.
KCB provides a dated company case for why ordinary and special distributions need separate columns. Its published schedule identifies KES 4 per share of ordinary distributions and KES 3 of special distributions for fiscal 2025 [2]. The Nairobi Securities Exchange daily price list recorded a KES 94 volume-weighted average price on 11 September 2026 [3]. On that dated observation, ordinary yield is approximately 4.26%, while the combined fiscal-year amount produces approximately 7.45%. Both calculations describe something useful, but they answer different questions. The first provides a starting point for evaluating recurring income. The second describes the distributions associated with that fiscal year. A forward budget can begin with an explicit ordinary-dividend assumption and add any separately justified special payment. That structure makes it easy to test how the household's income changes when a special distribution ends, while preserving the value of understanding the company's complete capital-return record.
Taxes and acquisition costs connect the quoted yield to the investor's actual outlay. The Kenyan resident individual qualifying-dividend withholding rate is 5%, subject to the investor and payment meeting the applicable conditions [4]. Applying that rate to KCB's KES 4 ordinary distribution gives KES 3.80 after withholding. If the KES 94 dated purchase observation carries a conservative 2% acquisition-cost allowance, the cash outlay is KES 95.88. Equation (1.2), net income yield on cost equals dividend after withholding divided by total purchase outlay, gives approximately 3.96%. The cost assumption can include the relevant commission, levies, and execution allowance once these are identified from a broker quote. The spreadsheet keeps that assumption editable. You can therefore compare providers, purchase sizes, and entry prices using the cash that actually leaves and returns to your account.
Price changes complete the ownership result. If the same share is sold after a year for KES 44, the sale proceeds must be reduced by the applicable disposal costs and combined with dividends received. If it falls to KES 32, the cash dividend still arrives under the illustration, but the overall investment result is lower. Equation (1.3), total return = net sale proceeds plus net distributions minus purchase outlay, all divided by purchase outlay, brings the pieces together. The appendix works through both outcomes manually. This is a useful way to compare an income strategy with other investments because it preserves both sources of equity return. It also shows how transaction costs matter more when a position is held briefly or repeatedly traded around small expected price differences.
Ask how the dividend is financed
Dividend sustainability begins with earnings, then moves to cash, capital requirements, and management's allocation choices. A payout ratio divides the ordinary dividend by earnings attributable to ordinary shareholders on a comparable per-share basis. A low ratio leaves room for retention, although the retained money still needs a productive purpose. A high ratio directs attention to reserves, exceptional gains, cash requirements, and whether the current earnings level represents normal operations. The useful output is a short explanation of the distribution policy and its financing. In the workbook, an editable payout threshold helps organise research. A company outside that threshold remains available for investigation, with the next question clearly identified. The threshold is a sorting preference, while the eventual judgement depends on the business and its balance sheet.
BAT Kenya's fiscal 2025 release offers a compact case for this investigation. It reports KES 70 dividend per share and KES 52.46 earnings per share, producing a payout ratio of approximately 133.44% [5]. That arithmetic directs attention to the resources supporting the distribution and the company's policy over time. Its responses to shareholder questions describe a distribution policy around 65% of earnings over time, with flexibility where reserves permit [6]. An investor can now ask a specific forward-looking question: what ordinary payment is consistent with normal earnings, necessary investment, and the desired reserve position? The workbook can test a lower payment alongside the reported amount. The result is a practical income range that helps size a position and reveals how much of the portfolio's cash budget depends on an elevated distribution continuing.
Cash analysis adds another perspective because profit and cash collection follow different timing. A manufacturer may recognise a sale before receiving the customer's money, build inventory ahead of demand, or pay suppliers later than usual. An investor can compare operating cash flow with profit over several years and examine the working-capital explanation for the difference. Capital expenditure then shows how much cash is being directed towards productive assets. The second workbook develops these relationships in detail, including a fully connected teaching model. At this screening stage, the useful outcome is simpler: identify whether the dividend is supported by recurring operating activity, existing cash, asset sales, additional borrowing, or a combination. Each source has a different implication for future income and for the resilience of the business during weaker trading conditions.
Banks require a different path through the same question. Their ability to distribute depends on earnings, credit losses, liquidity, regulatory capital, and the needs of subsidiaries. Growth in lending can absorb capital even when profits rise. Deposits are part of the operating model, so a manufacturer's cash-flow screen offers limited guidance for interpreting a bank's financing activity. The screening workbook therefore treats sector classification as the starting point for selecting the relevant diagnostic. For banks, the next stage examines asset quality, loss recognition, cost efficiency, and capital headroom. For insurers, it examines underwriting, investment results, reserves, and the ownership structure. For manufacturers, it examines margins, inventory, receivables, and capital expenditure. This gives the investor a common research purpose while preserving the economics that make each sector different.
Put Treasury bills on the same cash basis
Treasury bills provide a useful comparison because their contractual cash flows are relatively easy to map. The investor pays an amount today and receives the face value at maturity, subject to the sovereign meeting its obligation. CBK offers 91-day, 182-day, and 364-day tenors, and the dated auction notice supplies the relevant accepted yields and purchase prices [7]. The comparison becomes meaningful when the investor uses the actual settlement outlay, the maturity receipt, and the number of days committed. Those details distinguish a holding-period return from an annualised quotation. They also help connect the investment to a real payment deadline. Money intended for a known expense can be matched to a maturity, while longer-horizon capital can be considered alongside equities using a broader range of possible outcomes.
The auction dated 7 September 2026 reports accepted annual rates of 8.7687%, 8.9331%, and 9.0737% for the three tenors [7]. These are dated observations that establish a reference point for the exercises. The workbook reproduces the published clean prices from the yields and day counts, with small differences explained by rounding. A new investment decision can replace the rates with the next relevant auction or an actual accepted bid. This makes the calculator reusable as conditions change. It also supports a useful research habit: retain the auction date and distinguish a past accepted rate from a current offer or a future rollover assumption. Once those labels are clear, the arithmetic becomes straightforward and the investor can focus on timing, liquidity, and the return required from alternative uses of the money.
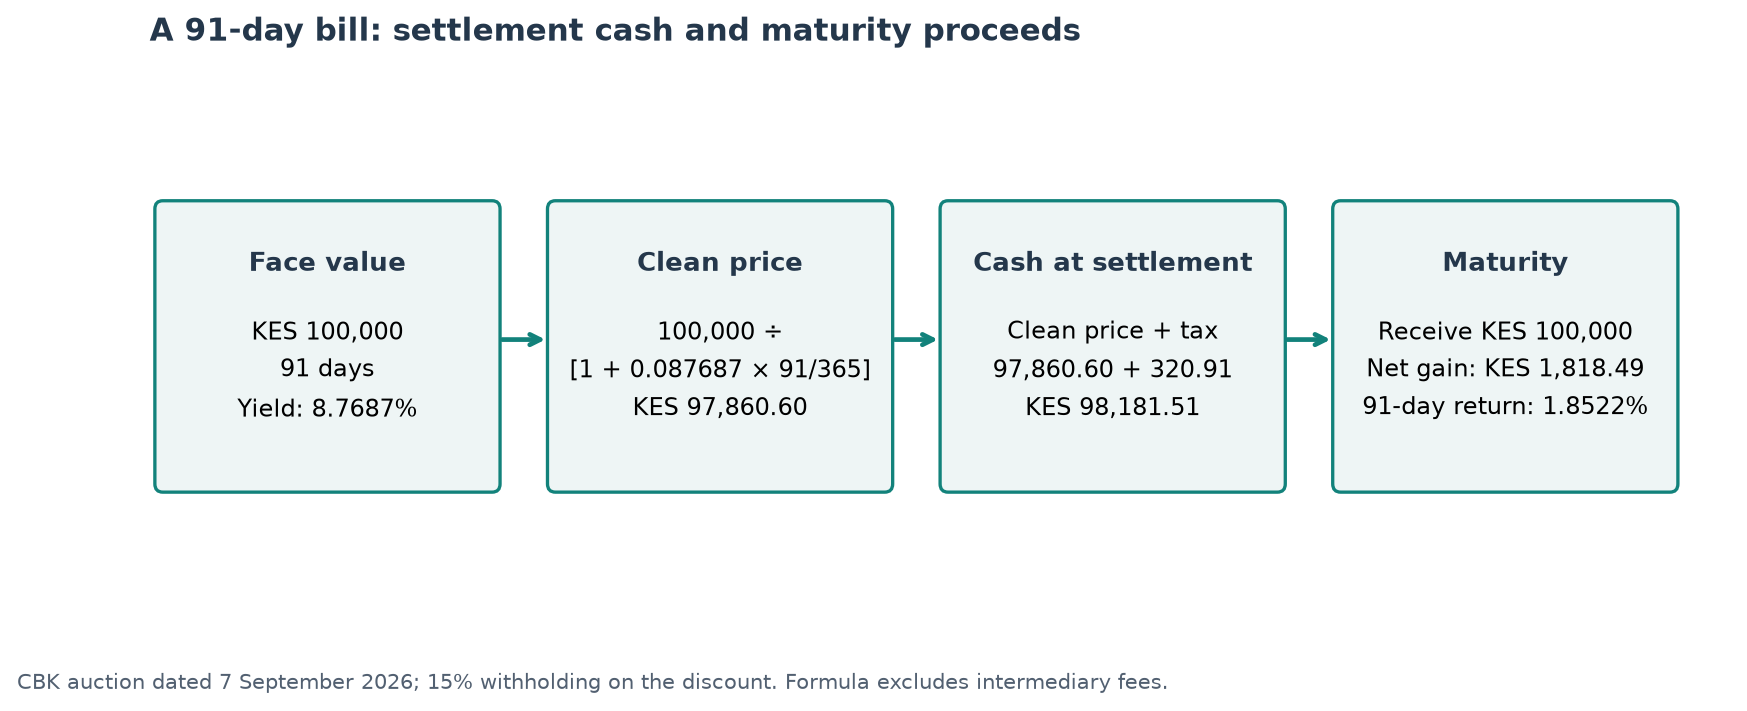
The settlement calculation includes tax at purchase. CBK's worked example shows an investor paying a tax-inclusive amount and receiving the full face value at maturity [8]. For KES 100,000 face value, the workbook first calculates the clean price, then the discount, then withholding on that discount, and finally the total settlement outlay. Equation (1.4), settlement outlay = clean price plus withholding on the discount, captures the sequence in ordinary language. The investment gain is the difference between face value and that outlay. This approach lets the investor reconcile the model to payment instructions and compare the bill with other investments using actual cash committed. The appendix sets out the pricing formula, substitutes every number, and explains why the taxable discount and the invested amount are different quantities.
Using the 91-day example, the clean price is approximately KES 97,860.60, withholding is KES 320.91, and settlement requires approximately KES 98,181.51. Receiving KES 100,000 gives a net gain of approximately KES 1,818.49 and a holding-period return of 1.8522%. These are calculations from the stated example inputs. Converting that return into an effective annual figure requires an additional reinvestment assumption. Under identical repeated terms, the annualised result is approximately 7.6388%. The investor can use that number to compare a convention consistently, while budgeting the actual KES 1,818.49 receipt for the specific bill. Separating the two measures keeps the calculation useful for both portfolio comparison and household cash planning, which operate on different questions about the same investment.
Rollover introduces a new decision each time a bill matures. Suppose four successive 91-day periods face progressively lower annual auction yields. The first rate is known when the first purchase settles, while the subsequent rates remain assumptions until later auctions. The rollover sheet exposes each rate separately and carries the maturity proceeds into the next purchase. It also rounds purchases to the chosen face increment and keeps unused cash visible. This gives a more realistic view of compounding for a finite account than assuming every shilling can be continuously reinvested. You can compare the resulting 364-day sequence with a single longer bill purchased at the outset. The interesting trade-off is between a known longer commitment and repeated opportunities to reset the rate and recover access to funds.
Match the income schedule to the household
A ladder organises maturities around a schedule. An investor might divide the bill allocation across several maturities or begin purchases at different auction dates so that portions become available at regular intervals. The practical benefit is a clearer link between the investment and planned spending. Building the ladder requires attention to minimum face values, the cash needed for settlement, and the auction timetable. The dated notice in the research pack sets the next noncompetitive minimum at KES 50,000 face value [7]. The investor should use the terms attached to the actual issue when implementing the plan. In the workbook, the face increment is editable and residual cash remains explicit. This allows a small account to explore feasible schedules before deciding how much capital can be committed at each date.
Dividend cash arrives on a different timetable. A company may pay once or twice in a year, and payments from several holdings can cluster around similar months. A portfolio with an attractive annual income total can therefore still produce an awkward spending pattern. The useful next step is a calendar of expected cash receipts beside the household's commitments. Where income arrives before it is needed, the investor can hold it in the relevant reserve. Where it arrives later, another source must fund the gap. This is one reason to evaluate shares and bills as complementary tools. Shares can contribute to long-term ownership and income growth, while scheduled maturities can help organise near-term cash. The mix becomes easier to maintain when every portion has an identifiable job and the timing is visible.
Inflation adds a second clock to the plan. A cash receipt can grow in nominal shillings while buying less of the goods and services the household needs. Equation (1.5), real growth factor = nominal growth factor divided by price-level growth factor, translates the investment result into purchasing power. With a hypothetical 8% net return and 5% inflation over a year, real growth is approximately 2.86%. The model later allows inflation to vary independently from market returns and contribution amounts. That distinction matters for income investors because a stable dividend may gradually cover a smaller share of expenses. It also matters for accumulation because a nominal target such as KES 3 million needs a date and a purchasing-power interpretation before its success can be evaluated consistently.
Taxes enter the comparison through the specific instrument and transaction. The research pack identifies the Income Tax Act provision covering gains on securities traded on a securities exchange licensed by the Capital Markets Authority [9]. The educational listed-equity sale examples use that exemption, while dividend withholding remains a separate cash item. The workbook keeps tax assumptions visible because investor classification, payment type, and transaction route affect their application. This structure makes it possible to compare the intended transaction with its legal category and retain the relevant source. It also makes the economics easier to see: a difference in tax treatment changes the net result, but the business outcome, acquisition price, sale price, and timing still determine how much wealth the investment creates or consumes over the holding period.
Turn the screen into a research queue
A useful screen reduces the number of questions competing for attention. It can begin with current trading eligibility, data completeness, a minimum liquidity requirement, an ordinary-income range, and a valuation measure suited to the sector. The seven populated dividend examples in the workbook provide a starting point across banking, telecommunications, consumer products, insurance, and energy. Their prices are illustrative, so changing a price immediately shows how the income comparison moves. Other directory rows remain ready for sourced financial inputs. This arrangement supports gradual expansion without turning missing information into a numerical conclusion. An investor can choose a sector, complete a small group of comparable companies carefully, and then extend the same process. Over time, the screening workbook becomes a research record that is easier to refresh and explain.
Data completeness is a practical advantage because it tells the investor where the next hour of work will be productive. A missing earnings figure may require a specific note in an annual report. A dividend that includes a special payment requires the corporate-action schedule. An uncertain share count may require checking a bonus issue, split, rights offer, or treasury-share movement. Record the period, units, group or company scope, and source beside the number as it is entered. If a report restates the comparative year, preserve that information so trends remain comparable. These details can look administrative, yet they directly affect ratios and valuation. A well-labelled figure can be checked and reused; an isolated percentage often requires the research to be repeated before anyone can confidently interpret it.
Liquidity screening connects research conviction with feasible ownership. A company can be attractive on cash generation and price while trading only small quantities on many days. For an investor building a modest position gradually, that may be workable. For someone who may need to exit quickly, the same market can be unsuitable for a large allocation. The portfolio workbook includes an assumed daily traded value and a participation fraction to estimate acquisition days. These are editable planning inputs, with actual trading evidence needed for implementation. The investor can also inspect bid and ask prices and use a limit price that expresses the maximum acceptable purchase cost. This makes position size responsive to market capacity as well as business conviction, preserving room to adapt if circumstances or information change.
The cash-conversion-cycle screen is particularly useful for manufacturers and distributors. It combines the time inventory is held, the time customers take to pay, and the time available before suppliers are paid. A short cycle can release cash for investment or distribution. A longer cycle can reflect deliberate expansion, weaker collections, slow stock, or altered supplier terms. The next article works through these alternatives using trade balances and a consistent denominator. The screen should therefore point towards the cause of a change. A negative cycle invites investigation of customer payment patterns and supplier arrangements, including whether extended payables remain sustainable. This is a good example of the overall approach: use the ratio to identify an economic question, then let the supporting disclosures determine how that question affects the investment case.
Qualitative observations belong beside numerical screens because they explain how the numbers might evolve. A durable distribution network, a strong brand, or a convenient payment platform can support recurring customer demand. Regulation, changes in consumer behaviour, governance, and financing requirements can alter the value of those advantages. The workbook's review log translates these broad subjects into specific evidence: pricing changes, customer concentration, capital allocation, related-party transactions, and management's record against earlier expectations. Each observation ends with a portfolio consequence, such as a different growth range, a smaller position, or an additional scenario to test. This keeps qualitative research connected to action. It also makes disagreement useful because two investors can identify the assumption on which their conclusions differ and examine what evidence would resolve it.
Make the comparison repeatable
At the end of this first stage, the investor should be able to explain each candidate in a few connected sentences. The explanation identifies the business, the ordinary distribution being evaluated, the purchase price and its date, the relevant tax and cost assumptions, and the next unresolved research question. It also identifies the alternative use of the money, including the dated bill comparison where appropriate. This short investment note becomes the bridge to deeper valuation. As new information arrives, the investor can update the affected assumption rather than rebuild the entire argument from memory. The note is especially useful when prices move quickly because it preserves the connection between the original reasoning and the current decision, allowing a deliberate response to either improved opportunity or a changed business outlook.
The first workbook can be used in a simple sequence: confirm the instrument and trading status, populate sourced financial fields, replace illustrative prices with dated quotes, inspect income and payout calculations, and compare the result with the bill cash schedule. The investor then takes the strongest unanswered questions into the statement and valuation workbook. This sequence leaves room for discoveries. A high-income candidate may become more interesting after a reserve analysis, while a modest-yielding business may reveal attractive reinvestment economics. A bill may fit a near-term commitment even when an equity offers a higher expected long-term return. The method makes these choices explicit and comparable. The next part develops the business analysis needed to move from a promising screen to a reasoned estimate of value.
Technical appendix and formula dictionary.
References
[1] Nairobi Securities Exchange, “Listed Companies”. [Online]. Available: Source. Accessed: Sep. 7, 2026.
[2] KCB Group, “Dividends”. [Online]. Available: Source. Accessed: Sep. 7, 2026.
[3] Nairobi Securities Exchange, “Daily Price List, 11 September 2026”. [Online]. Available: https://www.nse.co.ke/wp-content/uploads/11-SEP-26.pdf. Accessed: Sep. 12, 2026.
[4] Kenya Revenue Authority, “Withholding Tax”. [Online]. Available: Source. Accessed: Sep. 7, 2026.
[5] British American Tobacco Kenya, “2025 Full Year Results”. [Online]. Available: Source. Accessed: Sep. 7, 2026.
[6] BAT Kenya, “Responses to shareholder questions before AGM12June2026”. [Online]. Available: Source. Accessed: Sep. 7, 2026.
[7] Central Bank of Kenya, “Treasury bill auction results dated 7 September 2026”. [Online]. Available: Source. Accessed: Sep. 7, 2026.
[8] Central Bank of Kenya, “Financial Markets”. [Online]. Available: Source. Accessed: Sep. 7, 2026.
[9] Kenya Law, “Income Tax Act, First Schedule, gains on exchange-traded securities”. [Online]. Available: Source. Accessed: Sep. 7, 2026.
No public comments yet. The first thoughtful question can start the discussion.