Part 1: Understanding the Market Before Choosing a Fund
US Markets and Portfolio Construction, unified nine-part series. Research edition: 15 September 2026.
At the beginning of this research, the author presented a practical question: how can an investor combine a low-cost US equity foundation with a few deliberate ideas, without turning a portfolio into a collection of unrelated purchases? SPYM, QQQM, semiconductor funds and an options strategy all appeared in the discussion. Before any of them can be assigned a percentage, the words behind the products need to mean something.
A portfolio is a collection of claims on economic activity, arranged to finance a purpose. That purpose might be retirement spending, a future dollar expense, or long-term capital growth. A list of attractive securities is the beginning of research; a portfolio policy connects those securities to a time horizon, a tolerable loss and a source of cash when money is needed.
This series develops that connection in stages. We first define markets and instruments, then examine costs and legal structures. Only after that groundwork do we compare portfolio architectures and build a core. Satellites, risk measurement, options, tax, implementation and retirement follow. The sequence gives every calculation a reason to exist.
A market, an exchange and an index are different things
The US equity market consists of publicly traded ownership claims in businesses. An exchange is a venue on which securities trade. An index is a rule for selecting and weighting some of those securities. An exchange-traded fund, or ETF, is an investment vehicle that may seek to follow such an index.These distinctions become useful immediately. Buying a fund listed in the United States does not establish that every company it owns is American. Buying a Nasdaq-100 fund does not mean owning every company listed on Nasdaq. Buying three different ETFs does not establish that their underlying holdings differ.
| Term | Meaning | Practical consequence |
|---|---|---|
| Company | The business issuing an ownership claim | Earnings, balance-sheet strength and governance affect that claim |
| Security | The particular share, bond or contract owned | One company can issue several securities |
| Exchange | A marketplace for trading securities | Listing and trading currency are implementation details |
| Index | Rules defining an investment universe and weights | The rulebook determines the exposure being followed |
| Fund | A pooled investment vehicle | Its mandate, fees and legal structure affect the investor |
| Portfolio | The investor's combined holdings and obligations | Risk must be assessed across all the pieces |
| Benchmark | A reference against which a decision is assessed | A relevant comparison makes performance interpretable |
A good first research question is therefore: which economic universe is this product intended to represent? The ticker comes after the answer.
Four benchmarks, four different measurements
The S&P 500 is designed to represent US large-cap equities and uses float-adjusted market-capitalization weights. The Nasdaq-100 selects large non-financial Nasdaq-listed companies and modifies market-cap weights. The Dow Jones Industrial Average is a price-weighted selection of 30 companies. The Russell family provides broader size-based US equity universes. These are different measurements of the market, with different exclusions and maintenance rules. See the primary descriptions from S&P Dow Jones Indices, Nasdaq and FTSE Russell.
| Benchmark | Main question it answers | Weighting idea | What the label does not promise |
|---|---|---|---|
| S&P 500 | How are leading US large companies performing? | Float-adjusted market capitalization | Equal influence for every company |
| Nasdaq-100 | How are large eligible non-financial Nasdaq listings performing? | Modified market capitalization | A complete US market or pure technology exposure |
| Dow Jones Industrial Average | How is a selected group of major companies performing? | Share price, with a divisor | Influence proportional to company size |
| Russell 3000 | How is a broad US equity universe performing? | Float-adjusted market capitalization | Identical exposure to a large-cap-only benchmark |
| Russell 2000 | How are smaller companies within the Russell universe performing? | Float-adjusted market capitalization | Low risk merely because individual businesses are smaller |
Float adjustment counts shares available to public investors rather than assuming that every issued share is readily tradable. If the investable market value of one constituent is twice another's, a straightforward capitalization-weighted calculation gives it approximately twice the weight. Capping rules and eligibility decisions can modify that relationship.A price-weighted index behaves differently. If two constituents move by the same percentage, the security with the higher share price makes a larger point contribution. A stock split can therefore require a divisor adjustment even though no shareholder wealth is created. The index is answering a different question, and should be judged against that question.Index maintenance also matters. Reconstitution changes membership; rebalancing resets weights under the methodology. They are related processes, but are not synonyms. FTSE Russell moved its US index family to semiannual reconstitution from 2026. The operative schedule should be checked before using an annual-reconstitution assumption in research. FTSE Russell announcement.
What an equity return pays for
A shareholder receives the residual economic claim after operating expenses, lenders and other senior obligations. A profitable business can retain earnings to expand, repay debt, repurchase shares or distribute dividends. The investor's return combines cash received with the change in the market value of the claim.For one holding period, with the dividend paid at the end and no other cash flows:
Here \(P_0\) is the purchase price, \(P_1\) the ending price and \(D_1\) the distribution per share. This simple equation is enough to explain why dividend yield and total return answer different questions. A distribution can arrive while the share price falls by a larger amount.It also explains why a business can grow while its shares disappoint. The market price reflects expectations about future cash generation. If expectations at purchase were unusually demanding, respectable business results may still fail to justify the valuation paid. Conversely, a mature business can produce satisfactory shareholder returns if its price already reflects modest expectations.
| Observation | What it tells us | Additional question |
|---|---|---|
| Revenue grew | Sales increased | Did margins and cash generation improve? |
| Earnings grew | Accounting profit increased | How much reinvestment and financial risk supported it? |
| Dividend increased | More cash was distributed per share | Can the payment be sustained? |
| Share price rose | The market valued the claim more highly | Was the change driven by cash flows or valuation? |
| ETF distributions were high | Cash left the fund for shareholders | What happened to total return and tax? |
For an ETF, a published total-return series normally incorporates a specified reinvestment convention. A raw price series may exclude distributions. Comparing one fund's total return with another's price return produces a misleading result even when every number was copied accurately.
Risk has several dimensions
Volatility describes variability of returns. It is useful, measurable and central to portfolio mathematics. It is not a complete description of what an investor can lose.Drawdown measures a decline from a previous peak. Liquidity risk concerns the ability to transact at an acceptable price. Inflation reduces purchasing power. Currency changes alter what a dollar asset can buy in another currency. Concentration increases dependence on particular businesses or economic drivers. Sequence risk arises when withdrawals interact with the timing of returns.
| Risk | What can go wrong | Example of a relevant control |
|---|---|---|
| Market risk | Many securities decline together | Match risky-asset weight to the spending horizon |
| Business concentration | A few issuers drive the outcome | Aggregate company exposure across funds |
| Liquidity risk | An urgent sale receives a poor execution price | Keep near-term spending capital accessible |
| Interest-rate risk | Bond values respond to changing yields | Match duration to the role of the bond sleeve |
| Inflation risk | Nominal wealth buys less | Model spending in real terms |
| Currency risk | Assets and liabilities are in different currencies | Identify the currency of each planned expense |
| Behavioural risk | The investor abandons the policy under pressure | Write decision rules before a drawdown |
| Model risk | Estimated relationships fail | Use sensitivity analysis and scenarios |
Someone saving for an expense next year faces a different problem from someone accumulating for retirement in thirty years, even if both describe themselves as comfortable with risk. Willingness to watch prices fluctuate and financial capacity to absorb a loss should be evaluated separately.
The literature provides a language for decisions
Harry Markowitz's portfolio-selection work formalized a powerful insight: the risk of a portfolio depends on how its holdings move together. A volatile holding may have a different effect when added to two different portfolios. This is why a security cannot be assessed only in isolation. Markowitz, “Portfolio Selection,” 1952.William Sharpe's arithmetic of active management supplies a different discipline. Within a consistently defined market, active and passive dollars together own that market. Before costs, the active aggregate matches the market aggregate; higher active costs reduce the aggregate net result. The argument allows individual outperformance while requiring a reason to expect it. Sharpe, 1991.Factor research asks whether recurring characteristics help explain differences in returns. Value, size and profitability-related characteristics are examples of systematic exposures that can be studied rather than renamed after a winning fund. Empirical patterns vary across samples and can endure long periods of disappointing performance. Fama and French, 1993.These contributions are useful because they answer distinct questions. Markowitz helps combine risks. Sharpe disciplines expectations about paid discretion. Factor research helps name exposures. None supplies a universal allocation for a household with particular liabilities, tax residence and spending needs.
Broad exposure and a deliberate tilt
A core is an exposure intended to do the portfolio's main strategic work. In the equity sleeve, a broad-market fund can serve that function. A tilt intentionally changes the baseline exposure. It might increase growth, value, small-company, quality or sector weight.SPYM follows the S&P 500; QQQM follows the Nasdaq-100. Their combination can increase exposure to businesses present in both. The economic question is how much extra weight those overlapping companies receive, not how many ticker symbols appear on the account statement. Product facts and dated fee comparisons are developed in Part 2.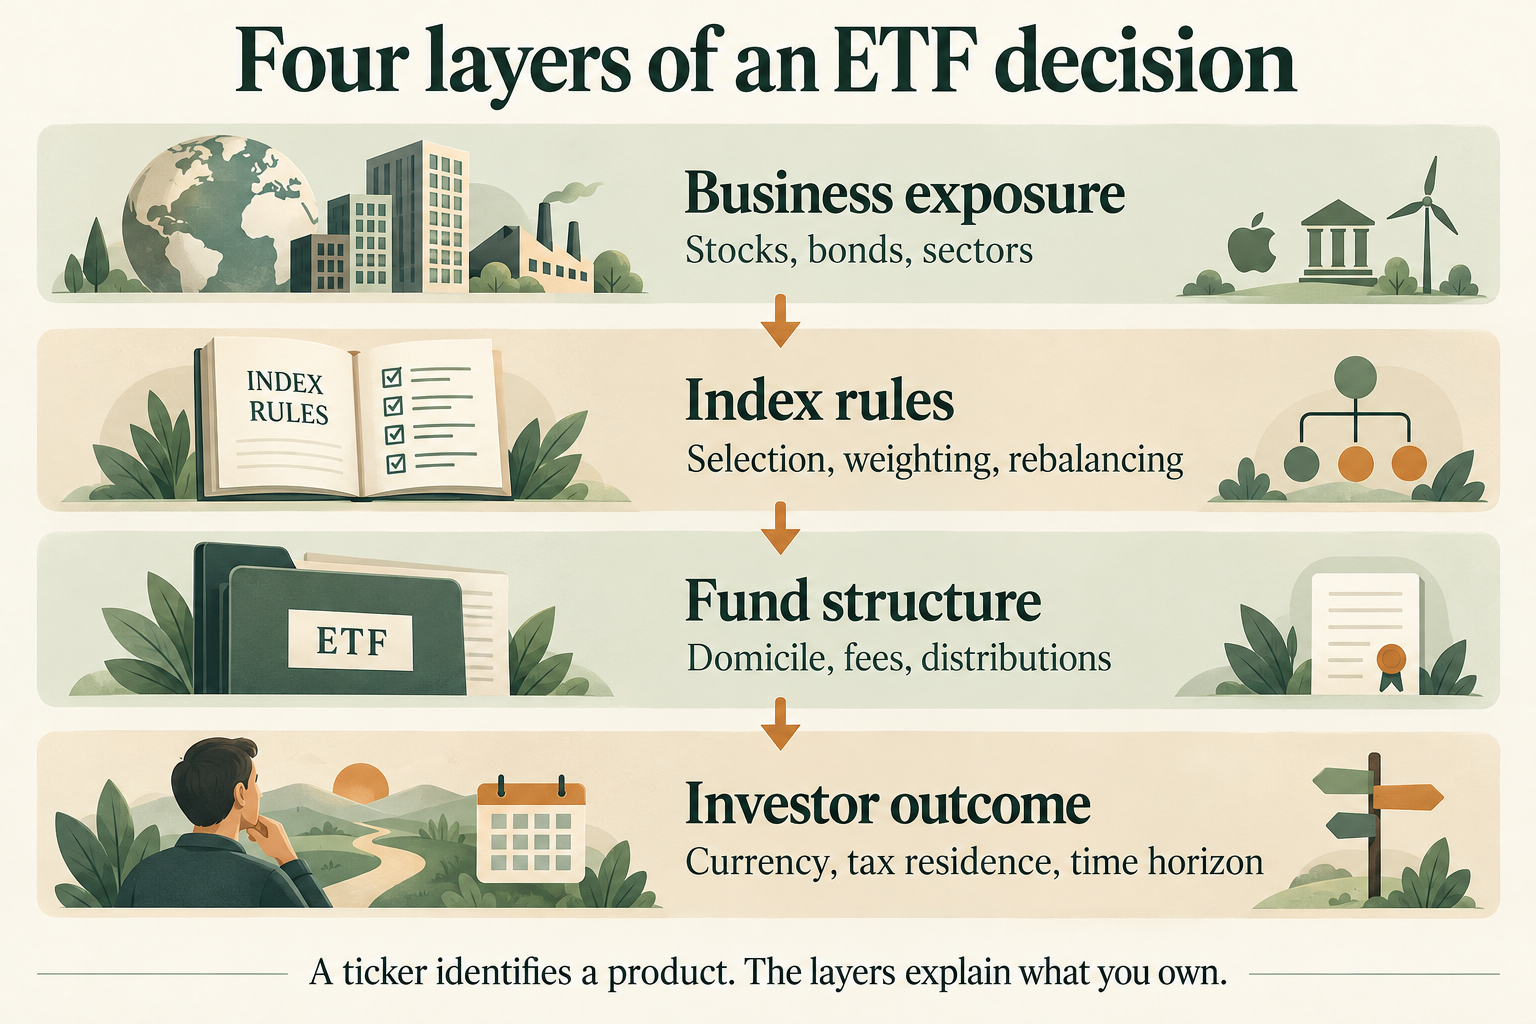
Figure 1. Each layer answers a different question. A convenient fund cannot resolve an unsuitable spending horizon or asset allocation.The same principle applies to a semiconductor fund. Its companies operate within a narrower industry already represented in broad equity benchmarks. Adding it may express an informed conviction. The added exposure should be described and sized as an industry overweight.A bond holding changes the question again. It introduces contractual cash flows, credit quality and duration. A cash reserve finances near-term needs. An option changes rights and obligations around an underlying asset. These instruments should not be interchangeable merely because each can produce a payment into the account.
A first research record
Before building the allocation, the investor can write one paragraph describing the capital's purpose, the currency in which it will eventually be spent, the earliest likely withdrawal and the loss that would impair that purpose. A second paragraph should identify existing exposures outside the proposed US account, including employment, property, pension assets and local-market investments.That record creates a boundary for subsequent research. A technology employee may already have income and deferred compensation tied to the same businesses that dominate a growth fund. A Kenya-based investor may measure wealth in shillings while saving for a dollar expense. An expatriate may have an account whose tax treatment changes when residence changes.The nine parts use real funds and selected dated issuer observations. Return paths, portfolio weights and option examples are labelled assumptions when they are assumptions. This keeps business facts, observed prices and future decisions distinct.The next part examines how the chosen exposure is packaged and paid for. It develops the difference between a fund's expense ratio, its trading cost and the amount of return the investor actually retains.
Technical companion
The cost and ownership mechanics that sit behind fund selection are derived in the cost, compounding and withholding appendix. A fund comparison begins with the market exposure, then carries the selected cost, wrapper and tax assumptions into the implementation model.
No public comments yet. The first thoughtful question can start the discussion.